Building and using coverage-instrumented programs with Go
tl;dr We can create coverage-instrumented binaries, run them and aggregate the coverage data from running both the program and the unit tests.
go test and tell anyone that will listen that you really hope to never have to deal with a build system for the rest of your life.Since Go 1.2 (Dec. 2013),
go test has supported test coverage analysis: with the ‑cover option it will tell you how much of the code is being exercised by the unit tests.So far, so good.
I've been wanting to do something slightly different for some time though. Imagine you have a command line tool. I'd like to be able to run that tool with different options and inputs, check that everything is OK (using something like
bats) and gather coverage data from those runs. Even better, wouldn't be neat to merge the coverage from the unit tests with the one from those program runs and have an aggregated view of the code paths exercised by both kind of testing?A word about coverage in Go
Coverage instrumentation in Go is done by rewriting the source of an application. The
cover tool inserts code to increment a counter at the start of each basic block, a different counter for each basic block of course. Some metadata is kept along side each of the counters: the location of the basic block (source file, start/end line & columns) and the size of the basic block (number of statements).This rewriting is done automatically by
go test when coverage information has been asked by the user (go test -x to see what's happening under the hood). go test then generates an instrumented test binary and runs it.A more detailed explanation of the cover story can be found on the Go blog.
Another interesting thing is that it's possible to ask
go test to write out a file containing the coverage information with the ‑coverprofile option. This file starts with the coverage mode, which is how the coverage counters are incremented. This is one of set, count or atomic (see blog post for details). The rest of the file is the list of basic blocks of the program with their metadata, one block per line:github.com/clearcontainers/runtime/oci.go:241.29,244.9 3 4
This describes one piece of code from oci.go, composed of 3 statements without branches, starting at line 241, column 29 and finishing at line 244, column 9. This block has been reached 4 times during the execution of the test binary.
Generating coverage instrumented programs
Now, what I really want to do is to compile my program with the coverage instrumentation, not just the test binary. I also want to get the coverage data written to disk when the program finishes.
And that's when we have to start being creative.
We're going to use
The current project I'm working on is called
I haven't used atomic as this binary is really a thin wrapper around a library and doesn't use may goroutines. I'm also assuming that the use of atomic operations in every branch a "quite a bit" higher then the non-atomic addition. I don't care too much if the counter is off by a bit, as long as it's strictly positive.
We can run this binary just as if it were built with
And let's have a look at
And that's when we have to start being creative.
We're going to use
go test to generate that instrumented program. It's possible to define a custom TestMain function, an entry point of a kind, for the test package. TestMain is often used to setup up the test environment before running the list of unit tests. We can hack it a bit to call our main function and jump to running our normal program instead of the tests! I ended up with something like this:The current project I'm working on is called
cc-runtime, an OCI runtime spawning virtual machines. It definitely deserves its own blog post, but for now, knowing the binary name is enough. Generating a coverage instrumented cc-runtime binary is just a matter of invoking go test:$ go test -o cc-runtime -covermode count
I haven't used atomic as this binary is really a thin wrapper around a library and doesn't use may goroutines. I'm also assuming that the use of atomic operations in every branch a "quite a bit" higher then the non-atomic addition. I don't care too much if the counter is off by a bit, as long as it's strictly positive.
We can run this binary just as if it were built with
go build, except it's really a test binary and we have access to the same command line arguments as we would otherwise. In particular, we can ask to output the coverage profile.$ ./cc-runtime -test.coverprofile=list.cov list
[ outputs the list of containers ]
And let's have a look at
list.cov. Hang on... there's a problem, nothing was generated: we din't get the usual "coverage: xx.x% of statements" at the end of a go test run and there's no list.cov in the current directory. What's going on?The testing package flushes the various profiles to disk after running all the tests. The problem is that we don't run any test here, we just call main. Fortunately enough, the API to trigger a test run is semi-public: it's not covered by the
There is still one little detail left. We need to call this
go1 API guarantee and has "internal only" warnings. Not. Even. Scared. Hacking up a dummy test suite and running is easy enough:There is still one little detail left. We need to call this
FlushProfiles function at the end of the program and that program could very well be using os.Exit anywhere. I couldn't find better than having a tiny exit package implementing the equivalent of the libc atexit() function and forbid direct use of os.Exit in favour of exit.Exit(). It's even testable.Putting everything together
It's now time for a full example. I have a small
calc program that can compute additions and substractions.$ calc add 4 8
12
The code isn't exactly challenging:
I've written some unit-tests for the
Let's run the unit-tests, asking to save a
Huh. 7.1%. Well, we're only testing the 1 statement of the
And run
We want to aggregate those profiles into one single super-profile. While there are some hints people are interested in merging profiles from several runs (that commit is in go 1.8), the cover tool doesn't seem to support these kind of things easily so I wrote a little utility to do it:
Unfortunately again, I discovered a bug in Go's cover and so we need
Not Bad!
Still not 100% though. Let's fire the HTML coverage viewer to see what we are missing:

Oh, indeed, we're missing 1 statement. We never call
add function only. We're going to run calc itself to cover the remaining statements. But first, let's see the unit tests code with both TestAdd and our hacked up TestMain function. I've swept the hacky bits away in a cover package.Let's run the unit-tests, asking to save a
unit-tests.cov profile.$ go test -covermode count -coverprofile unit-tests.cov
PASS
coverage: 7.1% of statements
ok github.com/dlespiau/covertool/examples/calc 0.003s
Huh. 7.1%. Well, we're only testing the 1 statement of the
add function after all. It's time for the magic. Let's compile an instrumented calc:$ go test -o calc -covermode count
And run
calc a few times to exercise more code paths. For each run, we'll produce a coverage profile.$ ./calc -test.coverprofile=sub.cov sub 1 2
-1
$ covertool report sub.cov
coverage: 57.1% of statements
$ ./calc -test.coverprofile=error1.cov foo
expected 3 arguments, got 1
$ covertool report error1.cov
coverage: 21.4% of statements
$ ./calc -test.coverprofile=error2.cov mul 3 4
unknown operation: mul
$ covertool report error2.cov
coverage: 50.0% of statements
We want to aggregate those profiles into one single super-profile. While there are some hints people are interested in merging profiles from several runs (that commit is in go 1.8), the cover tool doesn't seem to support these kind of things easily so I wrote a little utility to do it:
covertool$ covertool merge -o all.cov unit-tests.cov sub.cov error1.cov error2.cov
Unfortunately again, I discovered a bug in Go's cover and so we need
covertool to tell us the coverage of the aggregated profile:$ covertool report all.cov
coverage: 92.9% of statements
Not Bad!
Still not 100% though. Let's fire the HTML coverage viewer to see what we are missing:
$ go tool cover -html=all.cov
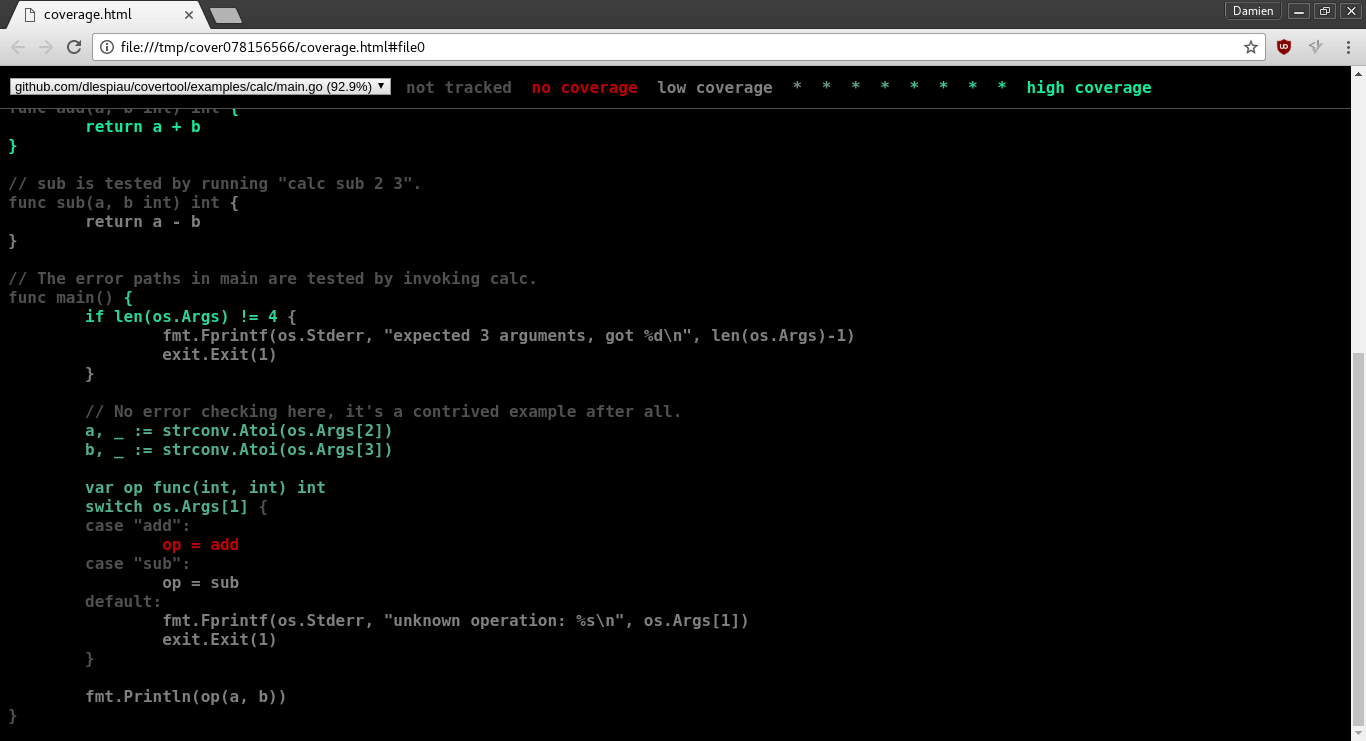
Oh, indeed, we're missing 1 statement. We never call
add from the command line so that switch case is never covered. Good. Seems like everything is working as intended.Here be dragons
As fun as this is, it definitely feels like very few people are doing this kind of instrumented binaries. Everything is a bit rough around the edges. I may have missed something obvious, of course, but I'm sure the Internet will tell me if that's the case!
It'd be awesome if we could have something nicely integrated in the future.